REEL Research: Ionic Characterization of Olentangy River
Research Contributors: Brian Laster, Clayton Casper, Saniya Kamran & Erica Howard
Introduction:
Algal blooms are a concern for water containing high concentrations of ions, specifically phosphate and nitrate1. Algae feed on these ions and enables dramatic population increases. However, algae have a short life span and their decay feeds on oxygen. When an abnormally high amount of algae bloom and then die, they deplete dissolved oxygen in 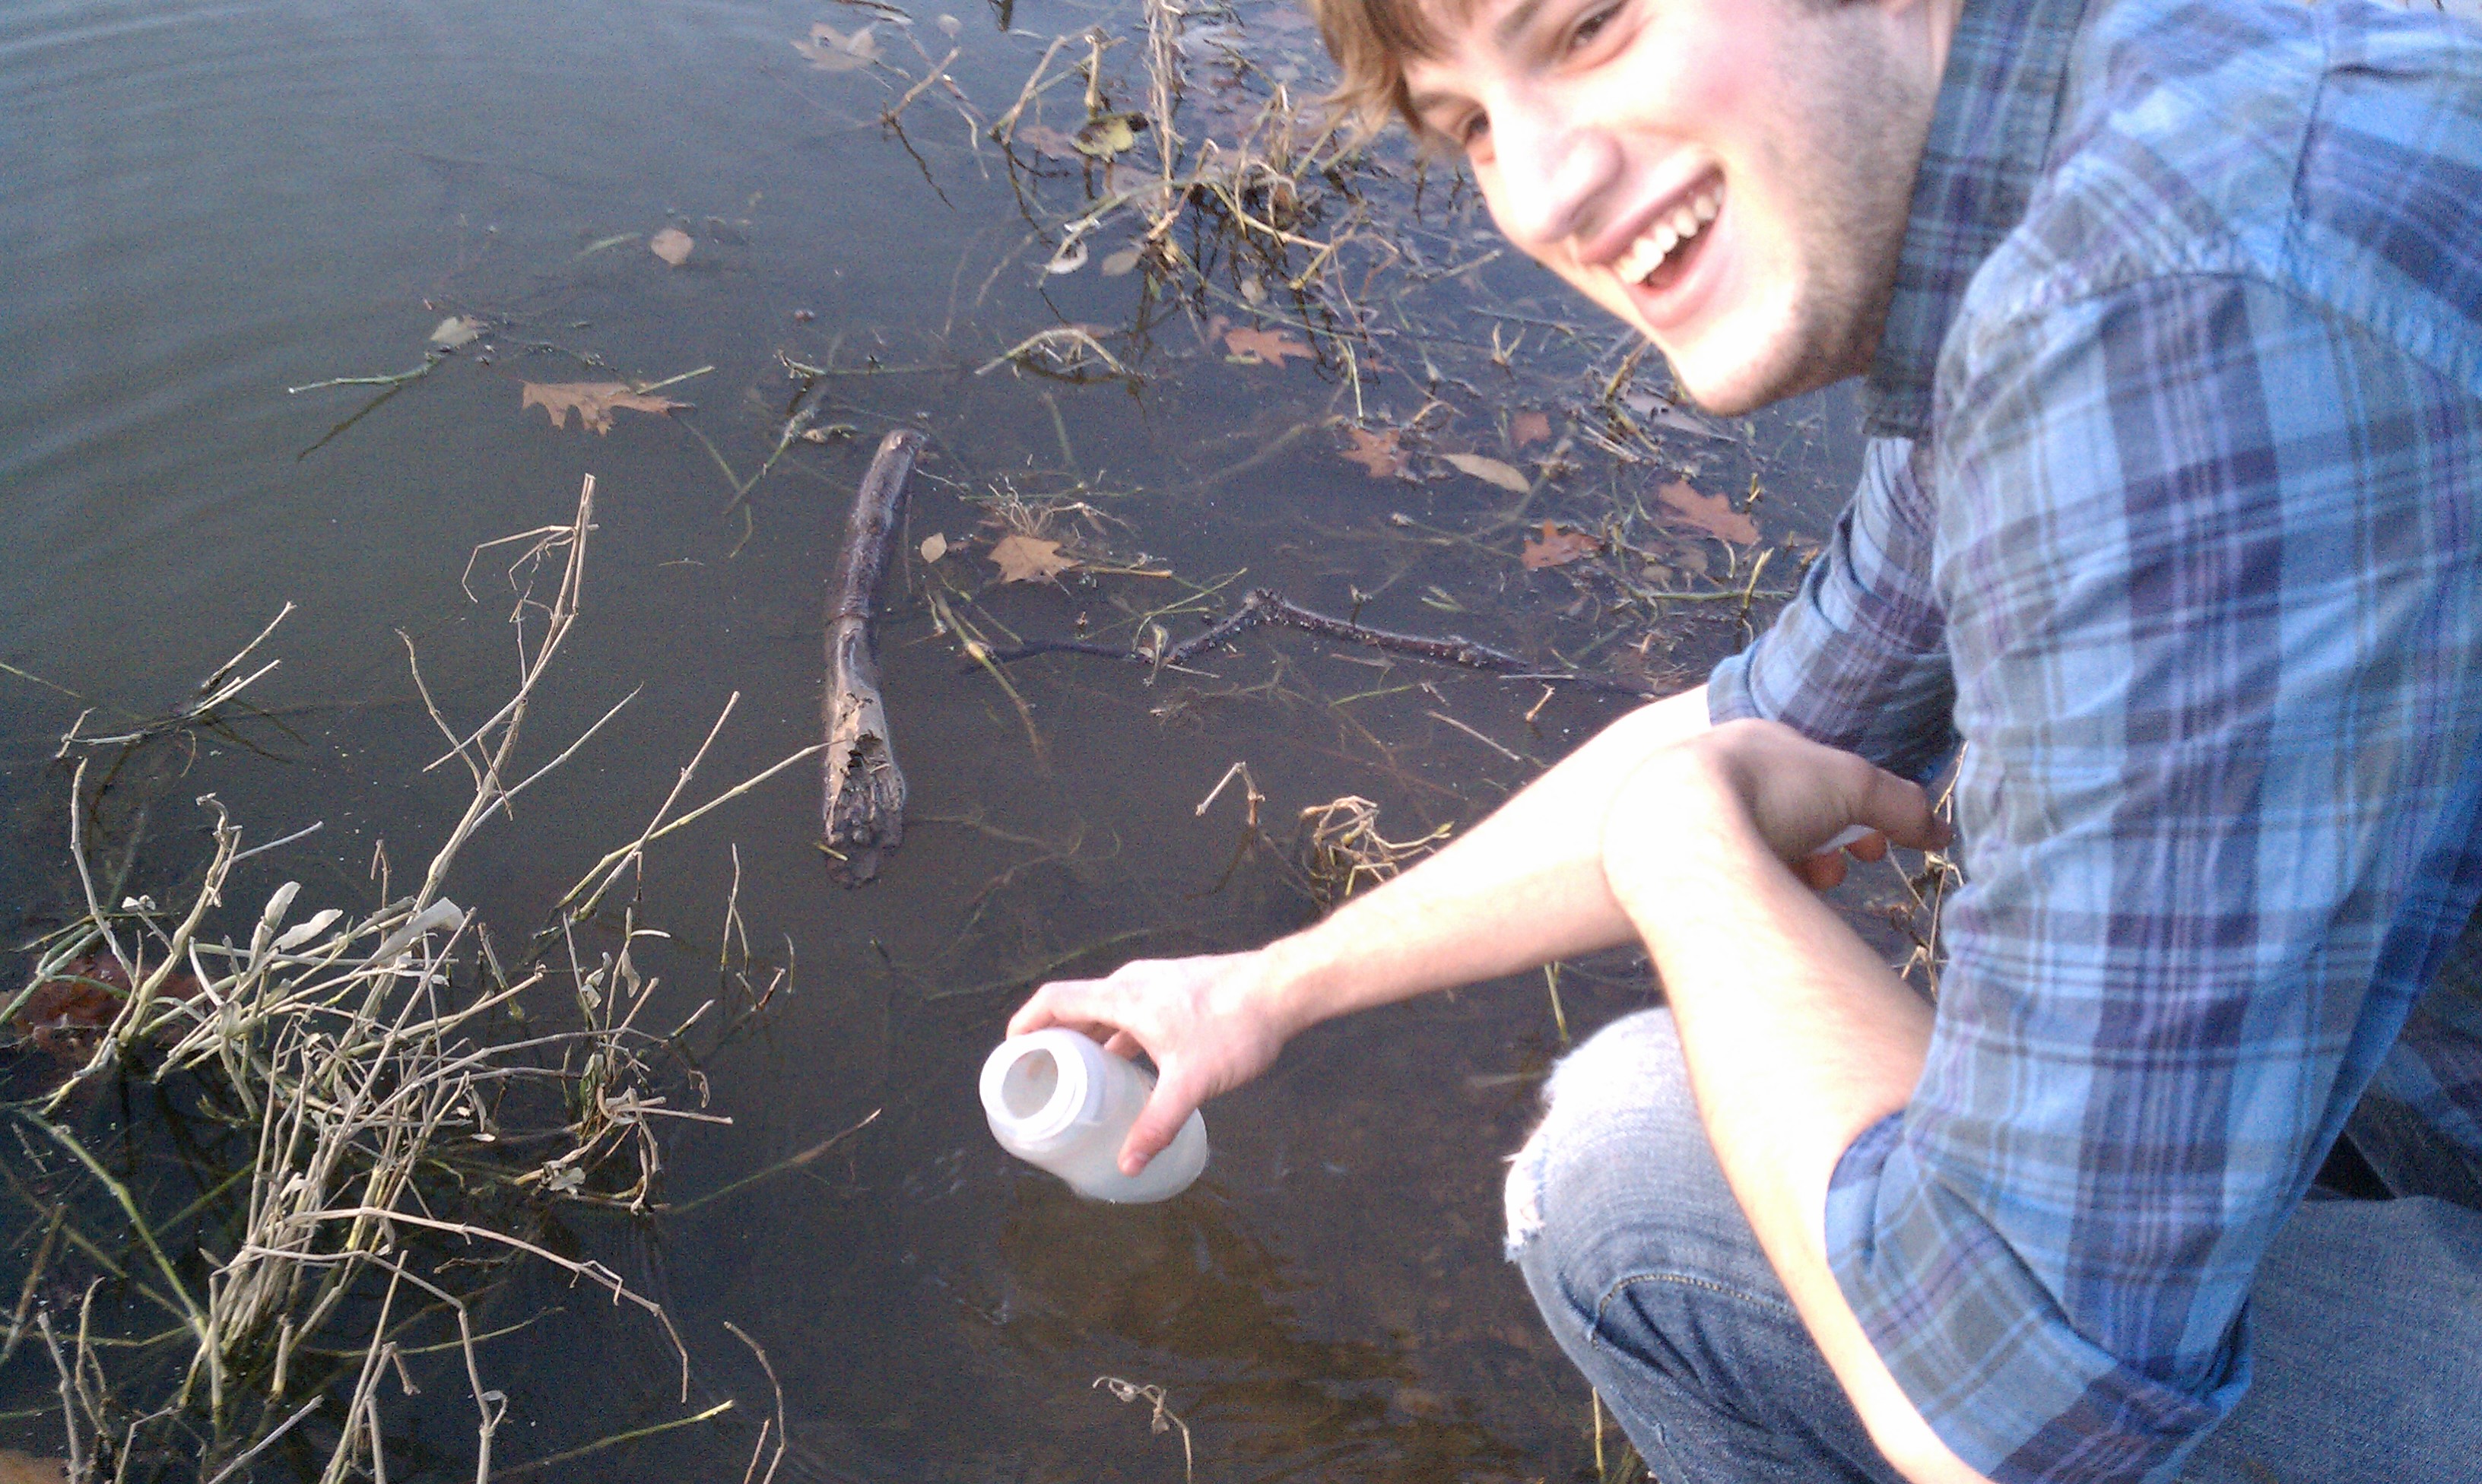 the water leaving aquatic organisms threatened. An increased supply of organic matter in an ecosystem is a process called eutrophication2. According to Anderson, eutrophication caused by increases in ionic content in bodies of water can be attributed to a variety of sources including sewage, usage of fertilizer, and animal waste1. Bodies of water continually affected by these sources could produce algal blooms which threaten aquatic organisms dependent on oxygen in the water.
The Olentangy River is home to four special interest, threatened, or endangered species of fish. In the lower Olentangy River alone, there are 48 species of fish, 19 of which are pollution intolerant3. The possibility of algal blooms is a threat to an aquatic environment that habitats a diverse and unique population.
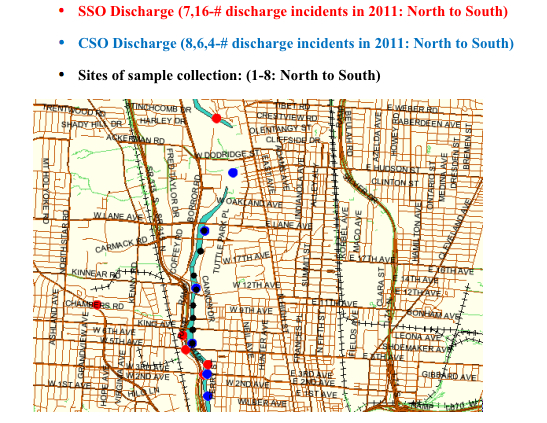
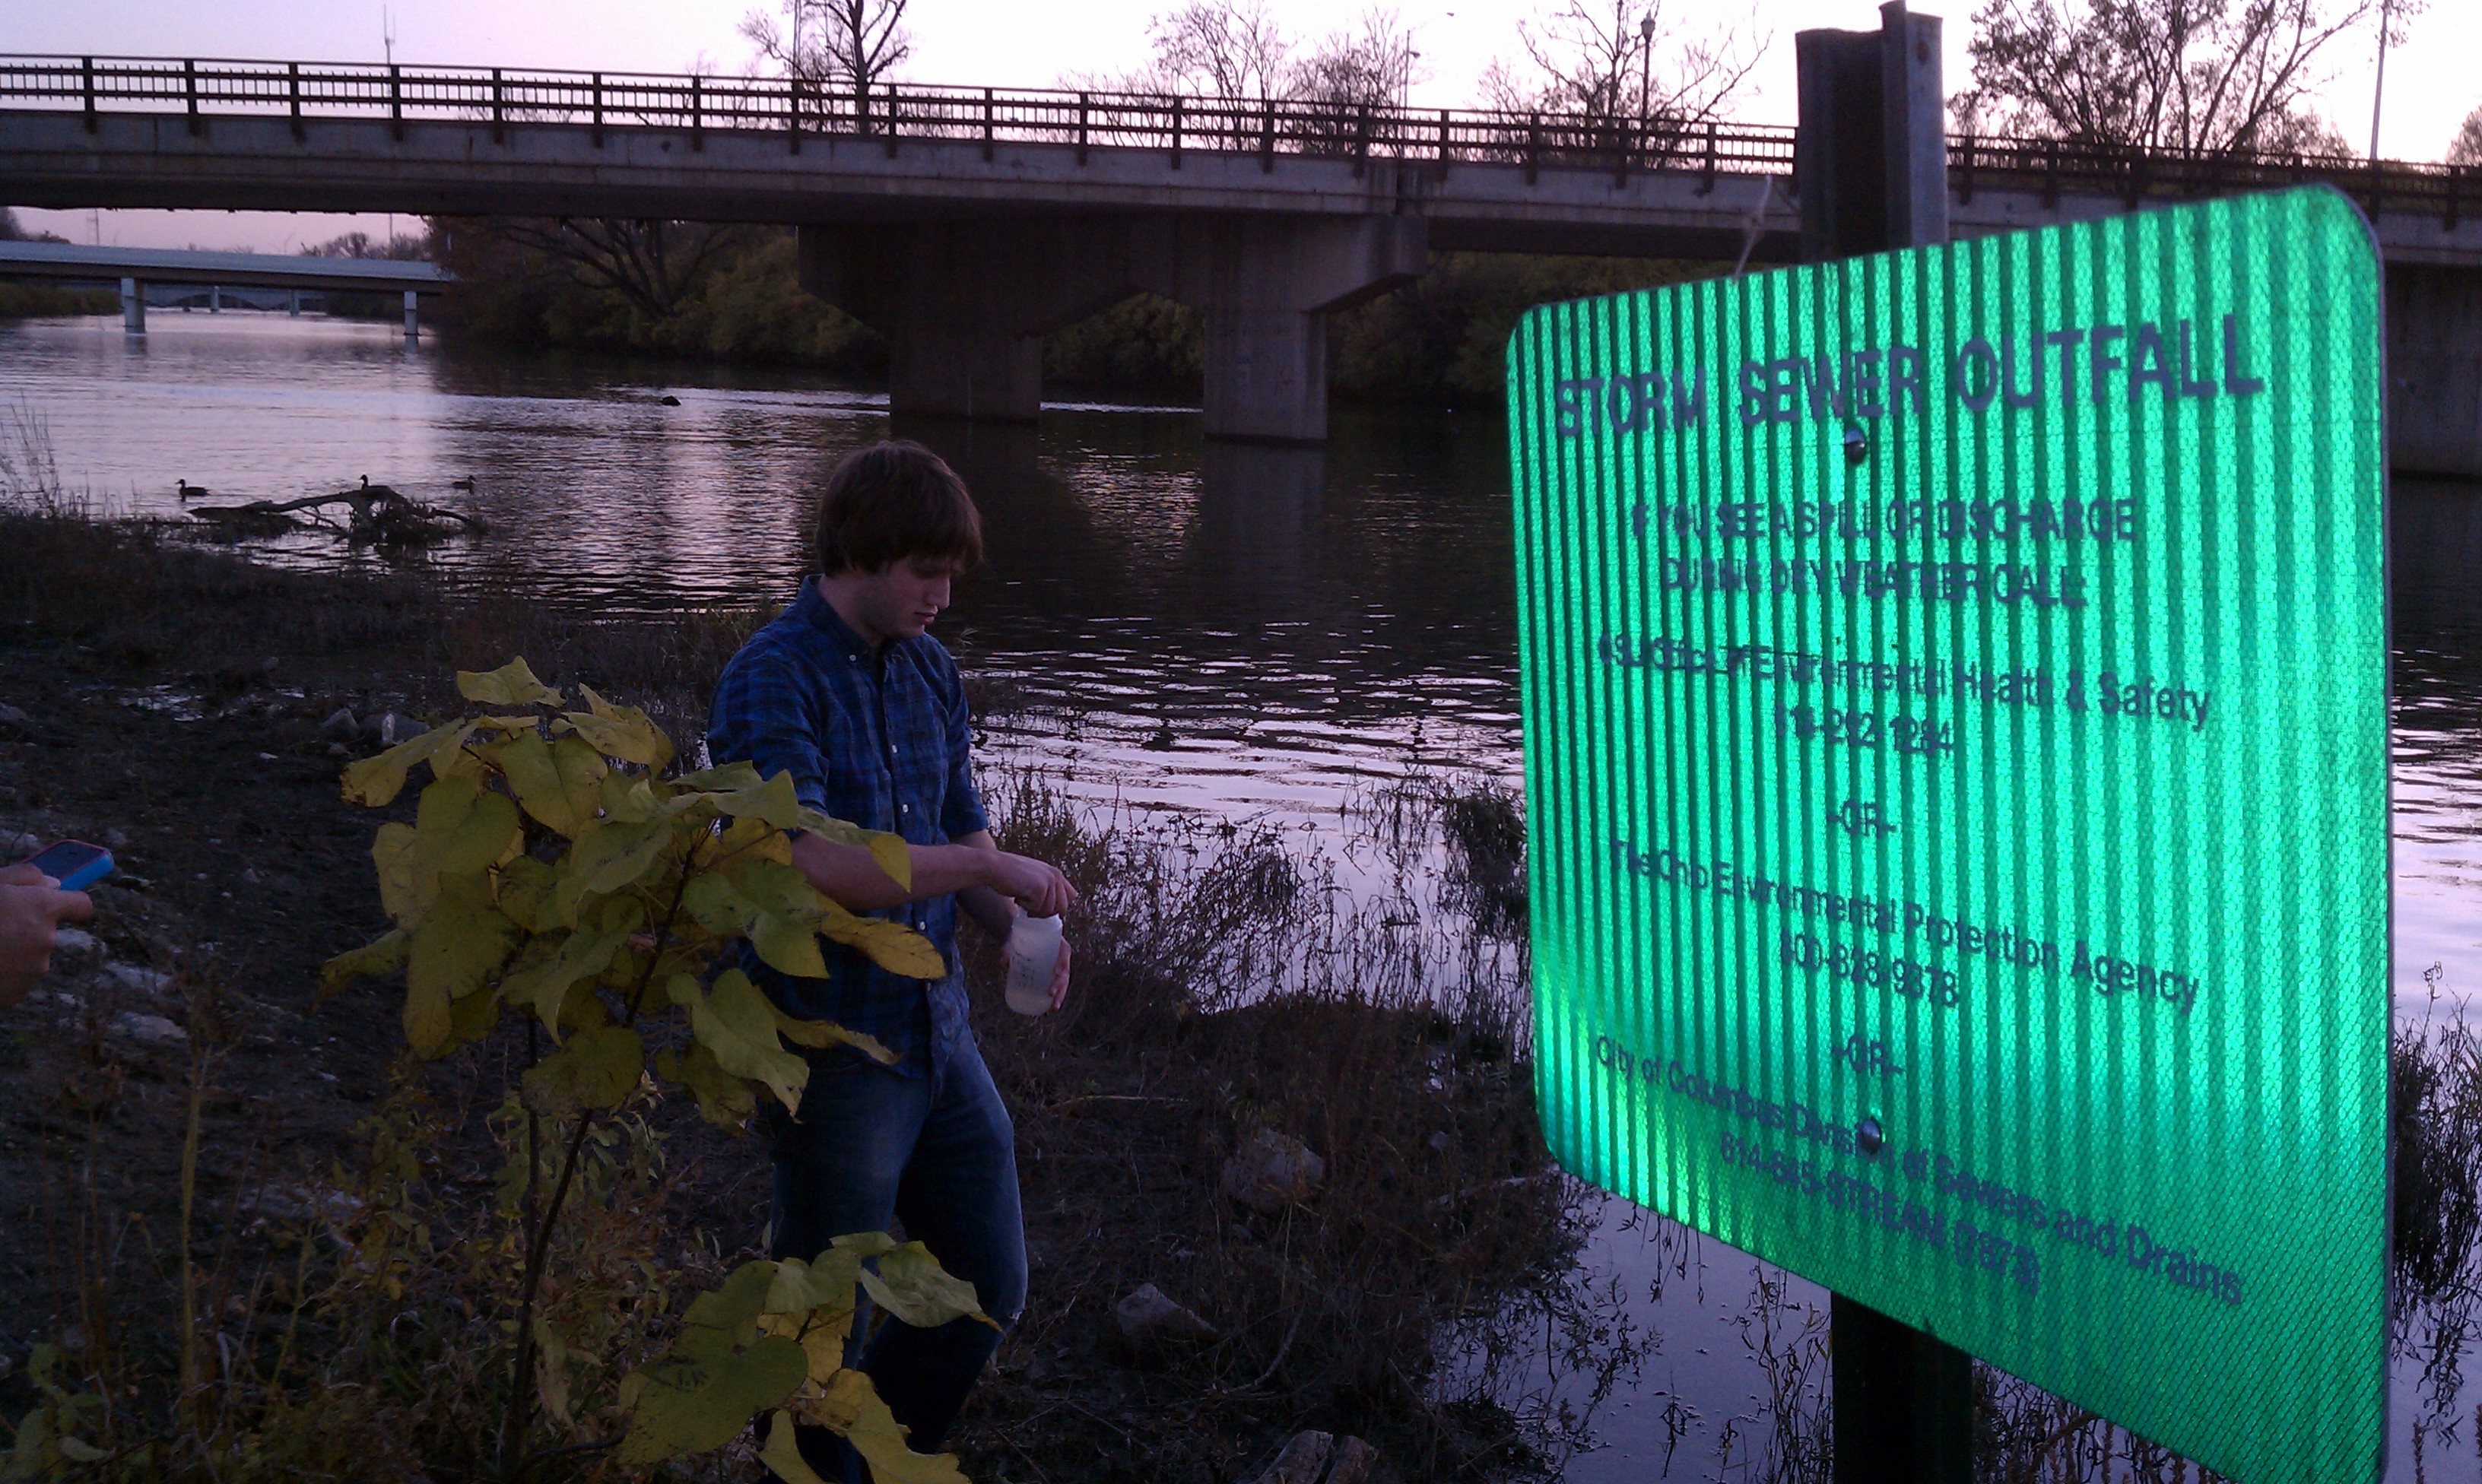
 A study of the ionic character of the Olentangy River was performed in the area between 5th Avenue (south) and Lane Avenue (north). This site contains two sanitary-sewer overflow and three combined-sewer overflow discharge locations. These sewer-overflows release untreated waste into the Olentangy River when heavy rainfall overflows the sewage drains4. It is suspected that there is an increased concentration of nitrates and phosphates in the Olentangy River due to the activity of the CSO and SSO locations. This presence could be adversely affecting the aquatic life in the area by increasing phosphates and nitrates which have been attributed to the formation of algal blooms.
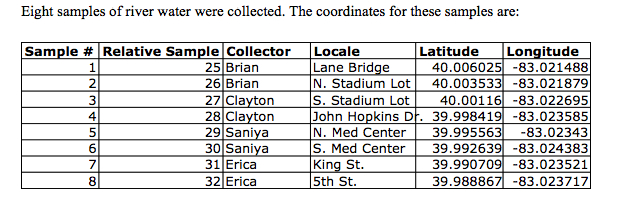
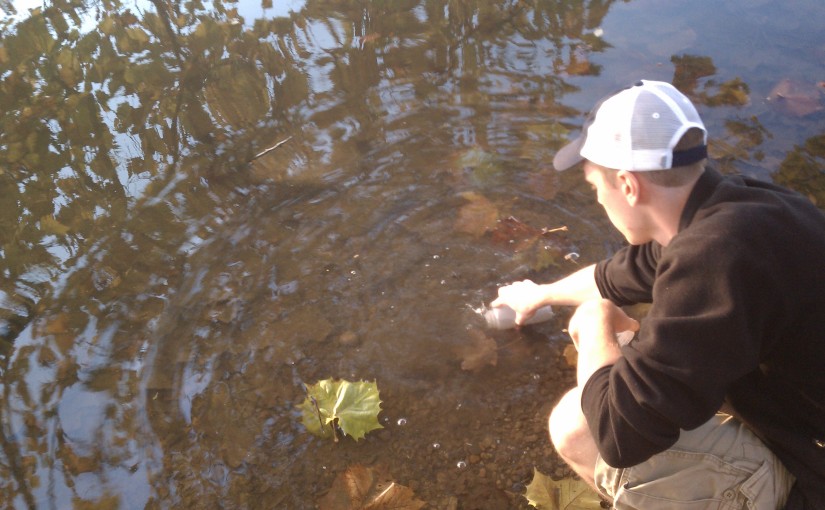
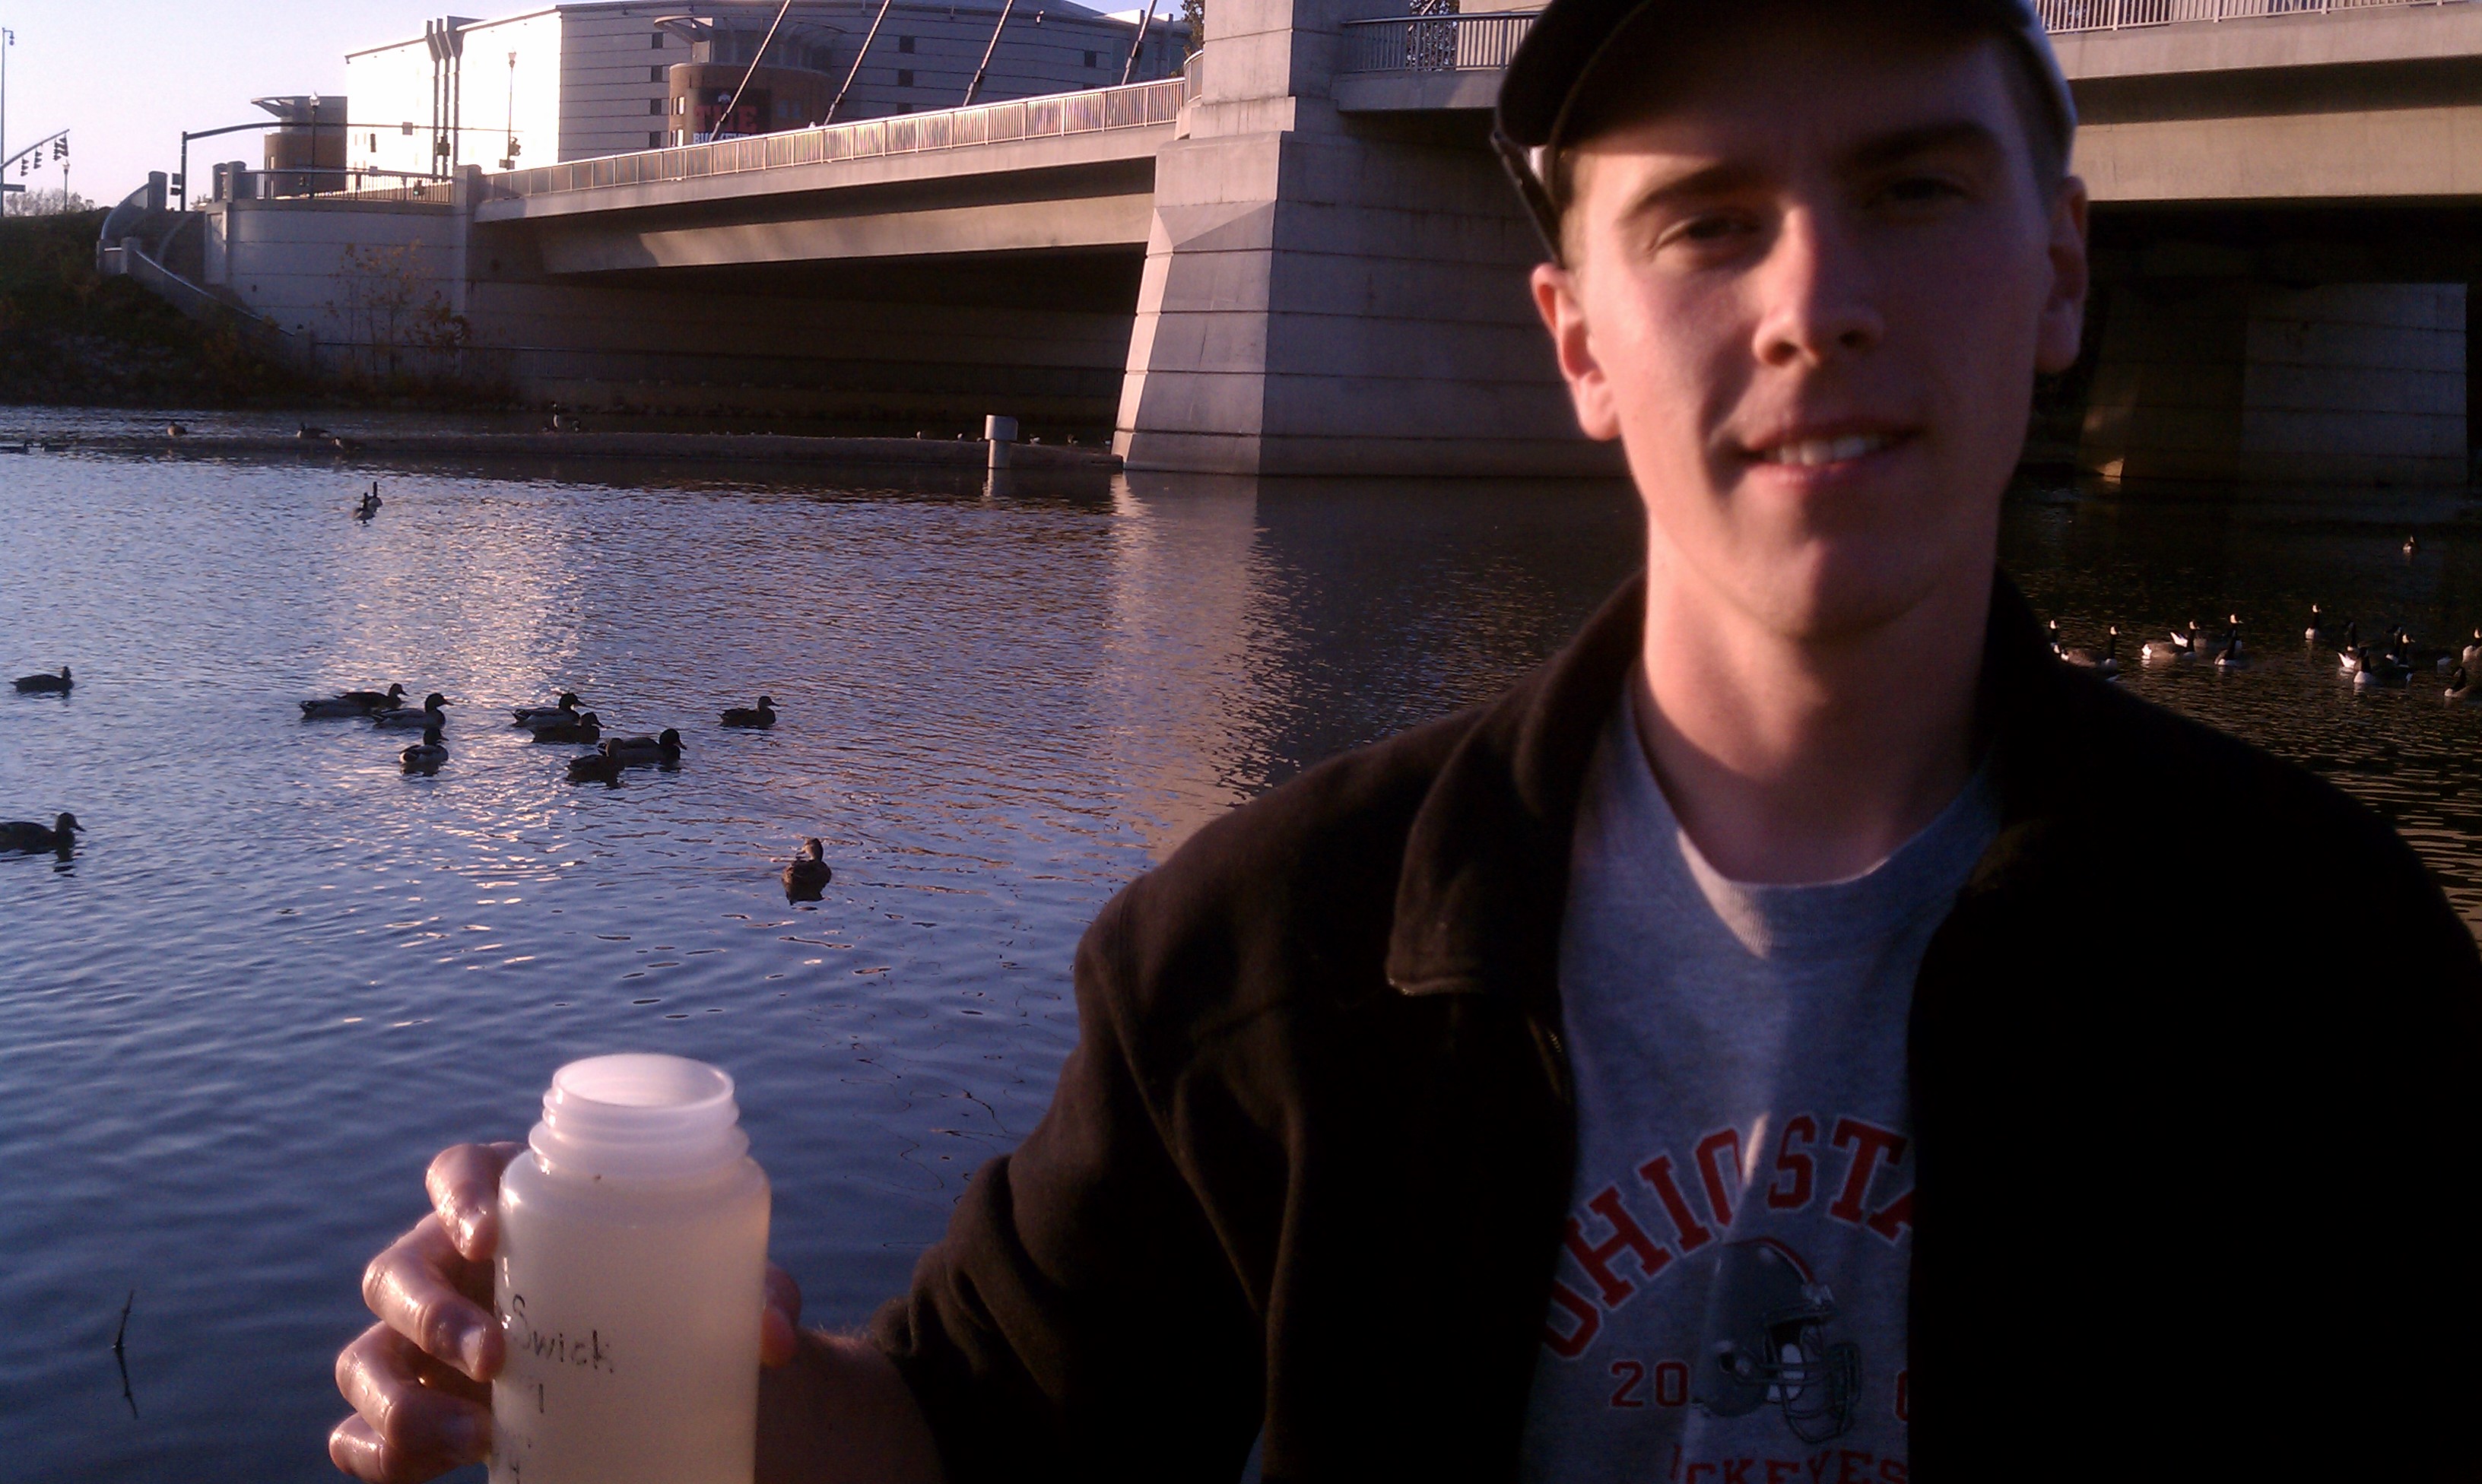
Sample Collection
Samples were collected in 500-ml plastic bottles. These bottles were rinsed with the river water several times before the sample was taken. All samples were filtered before analysis.
Method of Analysis
Water samples had their pH and buffer capacity measured. Analysis of the ions present in the samples was accomplished using an ion chromatographer. The importance and procedure of these measurements is detailed on the REEL research page5.
Data
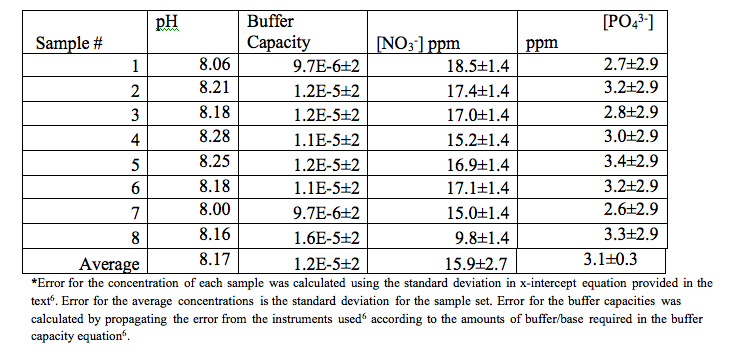
The pH of the river water is slightly basic. It is possible that this is a result of increased use of carbonic acid for photosynthesis from aquatic vegetation. However, these pH’s are in the range of healthy aquatic environments (6.5-9)7.
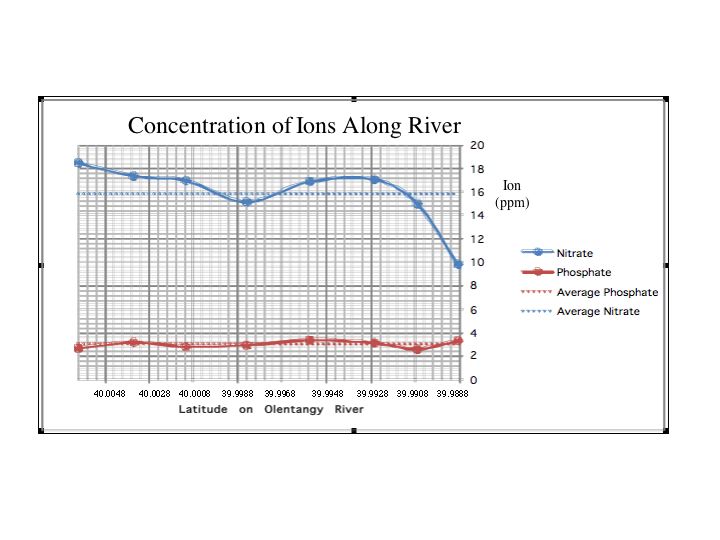
Exact concentrations of nitrate and phosphate are not quantified for the appearance of algal blooms. However, the presence of phosphate in this ecosystem is a concern because algal blooms will not form without the presence of phosphate8.
Data Analysis
The concentrations of phosphate and nitrate for the studied portion of the river were statistically compared to four other data sets from the Olentangy River. These data sets contained concentrations for the same ions of study and were from portions of the river significant to the research.
-To test for sameness in this group’s research, a statistical comparison was made between our data and a separate class data set for the same region (5th to Lane).
-To test for relative contamination of the 5th to Lane portion, a statistical comparison was made between our data set and the entirety of the Olentangy river data set.
-To test for changes in concentration over time, a statistical comparison was made between our data set and the data set from 2009 for the same region.
-To test for the affects of SSO/CSO, a statistical comparison was made between our data set and the data set of 5th to Fishinger. There is a confluent river to the Olentangy in between 5th Avenue (south) and Fishinger Road (north). This river contains no CSO/SSO discharge locations. However, this river lies approximately 3 miles west of the studied portion of the Olentangy. The CSO/SSO locations become the independent variable between the rivers. Therefore, the hypothesis can be accurately tested.
SourceURL:file:///Users/tedclark/Desktop/221-REEL-Fall2011/Student-Web%20Research%20Reports/Group%204-use%20docx/Group4.doc
Nitrate
|
Test |
Result |
|
F-Test (Lane to 5th v. Replicate) |
Passed |
|
T-Test (Lane to 5th v. Replicate) |
Passed |
|
F-Test (Lane to 5th v. Whole River) |
Passed |
|
T-Test (Lane to 5th v. Whole River) |
Failed (Lane to 5th is higher) |
|
F-Test (Lane to 5th v. 2009 Data) |
Failed |
|
T-Test (Lane to 5th v. 2009 Data) |
Failed (Current data is higher) |
|
F-Test (Lane to 5th v. Fishinger to 5th ) |
Failed |
|
T-Test (Lane to 5th v. Fishinger to 5th ) |
Passed |
The data collected in this research is consistent with another group’s data for the same section. The concentration of nitrate is larger in the 5th to Lane section than that of the entire river. The nitrate levels have increased over time. The nitrate levels are the same in the area with CSO/SSO discharges as in the area without.
SourceURL:file:///Users/tedclark/Desktop/221-REEL-Fall2011/Student-Web%20Research%20Reports/Group%204-use%20docx/Group4.doc
Phosphate
|
Test |
Result |
|
F-Test (Lane to 5th v. Replicate) |
Passed |
|
T-Test (Lane to 5th v. Replicate) |
Passed |
|
F-Test (Lane to 5th v. Whole River) |
Passed |
|
T-Test (Lane to 5th v. Whole River) |
Passed |
|
F-Test (Lane to 5th v. 2009 Data) |
Failed |
|
T-Test (Lane to 5th v. 2009 Data) |
Failed (Current data is higher) |
|
F-Test (Lane to 5th v. Fishinger to 5th ) |
Passed |
|
T-Test (Lane to 5th v. Fishinger to 5th ) |
Passed |
The data collected in this research is consistent with another group’s data for the same section. The concentration of phosphate is not significantly higher in the 5th to Lane section than that of the entire river. The phosphate levels have increased over time. The phosphate levels are the same in the area with CSO/SSO discharges as in the area without.
Discussion and Conclusion
With the increasing amount of anthropogenic activities effecting the Olentangy River it was hypothesized that the concentration of nitrate and phosphate ions in the river are also increasing due to CSO and SSO discharge. The samples taken were analyzed via ion chromatography and the concentration of nitrate and phosphate were determined to be 15.9 ± 2.7 ppm and 3.0 ± 0.3 ppm respectively. These concentrations were compared with historical concentrations found in 2009. The nitrate and phosphate concentration was found to be statistically higher than their respective concentrations in the 2009 data set. This data is concerning because increased nitrate and phosphate concentrations have been shown to cause the formation of harmful algae blooms which in turn can cause harm to plant, fish, and mammal life.
However, the concentrations from 5th to Lane Ave. were compared to a region (5th to Fishinger) of the Scioto River, a confluent river to the Olentangy. The region sampled had no CSOs or SSOs upstream of the sampling site .The nitrate and phosphate concentrations were found to be statistically the same. Therefore the initial hypothesis is rejected: CSOs and SSOs were found to have a minimal effect on the nitrate and phosphate concentrations in the Olentangy River.
Future Research
Future research includes identifying major pollutants within the Olentangy, monitoring the oxygen levels with the use of a Clark polarographic electrode, and attempting to introduce methods to reduce the amount of nitrate and phosphate in the river. Such future research would not only benefit the water quality and river ecosystem but would benefit the Columbus community as well.
Supporting references
1. Anderson, D. M.; Glibert, P. M.; Burkholder J. M. Harmful Algal Blooms and Eutrophication: Nutrient Sources, Composition, and Consequences. Estuaries 2002, 25, 704-726.
2. USGS. Toxic Substances Hydrology Program. http://toxics.usgs.gov/definitions/eutrophication.html (accessed Nov 30, 2011).
3. Friends of the Lower Olentangy Watershed. Biology of the Lower Olentangy. http://www.olentangywatershed.org/files/Inventory/Inventory_section5.pdf (accessed Nov 30, 2011)
4. City of Columbus, Official Website for Columbus, Ohio: Sewer Overflow Discharge Information. http://gis.columbus.gov/ssocso/mnmap.aspx (Accessed November 13, 2011) – Figure 1
5. Ohio State Analytical Chemistry. REEL Project, Instrumentation: Overview of Instrumentation. http://research.chemistry.ohio-state.edu/reel/research-modules/environmental-chemistry/
6. Harris, D.C. Quantitative Chemical Analysis, 7th ed; W.H. Freeman and Company. New York, 2007
7. Lower Colorado River Authority. Water Quality Indicators. 2011. http://www.lcra.org/water/quality/crwn/indicators.html (accessed December 2, 2011)
8. Kennesaw. Eutrophication and Recovery in Experimental Lakes: Implications for Lake Management. http://science.kennesaw.edu/~jdirnber/limno/Schindler%201974.pdf. (Accessed Nov 30, 2011)