
Analysis of the Influence of SSO and CSO Discharge Points upon Ionic Concentrations
Research Contributors: Christopher R. Brue, Patrick S. Druggan, Cindy X. Lin, and Brett R. Potts
Background: Located in central Ohio, the Olentangy Watershed spans from the Delaware Dam to the Scioto River and covers 32 miles of land. Adena Brook, a modest east-west flowing tributary within the watershed, is situated in the suburbs of northern Columbus and winds along the southern boundary of the Park of Roses. All the waterways within the watershed are subject to a variety of forms of pollution and chemical contamination as a result of human activity. It is proposed that human activity, namely in the form of sanitary sewage overflows (SSOs) and combined sewage overflows (CSOs), contributes significantly to the overall long term deterioration of the water quality of the Olentangy River system. Due to sewage overflows, it seems plausible that there are elevated concentrations of certain ions, derivatives of raw sewage, in the watershed. Sodium, calcium, magnesium, potassium and nitrate are among the ions present in relatively high concentrations in the constituents of sewage.
CSOs and SSOs are safeguards built into the city infrastructure and are designed for handling heavy rainfalls. During periods of heavy rainfall, sewers may rise above a designated safe level. When this happens, discharge locations release either excess sewage, for SSOs, or a combination of sewage and run-off, for CSOs.
Sample Collection and Analysis
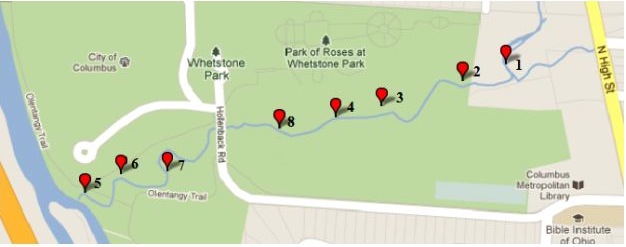
GPS Coordinates
|
Sample |
Latitude |
Longitude |
|
1 |
40° 2.609’ |
83°1.2698′ |
|
2 |
40° 2.591 |
83°1.327′ |
|
3 |
40° 2.566 |
83°1.431′ |
|
4 |
40°2.555′ |
83°1.491′ |
|
5 |
40°2.478′ |
83°1.813′ |
|
6 |
40°2.497′ |
83°1.767′ |
|
7 |
40°2.500′ |
83°1.708′ |
|
8 |
40°2.543′ |
83°1.562′ |
Eight samples of approximately 500 mL were collected for analyzing Adena Brook and the overall influence of sanitary sewage overflows (SSOs) and combined sewage overflows (CSOs). There is a SSO/CSO discharge site located along the roadside leading to the Park of Roses. Four samples were collected upstream from the discharge point and four were collected downstream. The samples were taken only in areas of flowing water, free of silt, and then were refrigerated for preservation.
After completing a comparison of the different methods available for analyzing the samples, ion chromatography was selected to observe the broad range of ions present in the matrix.
Data Analysis Concentrations were calculated from the calibration curve (see above link for explanation) and submitted to a database containing samples from other tributaries and locations within the watershed. First, a comparison was made between present results and historical results from the same area of Adena Brook to see the time effect on water quality, the latter data collected in 2009. Next, the downstream samples were juxtaposed with upstream samples to see if the SSO discharge location had an immediate effect on the stream. To ensure that SSO discharge was the main contributor for increased concentration levels, if any, the data from Turkey Run, a similar tributary with no SSO or CSO locations nearby, was also analyzed. Lastly, data from samples taken in close proximity to the SSO discharge location at 5th Avenue and Olentangy River Road were observed, since the aforementioned location had an SSO discharge event that occurred closer to the time of collection than Adena Brook.
Statistical comparisons were made using the F-Test and the t-test. The F-test is used to compare the level of variance in each of the data sets. The results of this test effect how the “t-value” is calculated in the student’s t-test. The student’s t is used to determine if the two data sets yield statistically the “same” answer, to a certain level of confidence. Lastly, to determine if the collected data yielded comparatively higher or lower results than other locations, the a test for biased was used. This test is identical to the students t-test except a 90% Confidence Level tabulated t-value was used.
Results:
Adena Brook:
| Samples | Chloride | Nitrate | Phosphate | Sulfate | Sodium | Potassium | Calcium |
| ppm | ppm | ppm | ppm | ppm | ppm | ppm | |
| REEL u1 | 84.3 | 5.49 | 3.80 | 76.2 | 48.6 | 6.29 | 71.5 |
| REEL u2 | 86.6 | 5.25 | 3.51 | 75.8 | 50.1 | 5.46 | 76.8 |
| REEL u3 | 87.0 | 4.69 | 3.61 | 77.0 | 50.6 | 5.46 | 76.4 |
| REEL u4 | 86.5 | 4.49 | 3.06 | 76.7 | 50.2 | 4.89 | 78.3 |
| REEL u5 | 84.7 | 3.74 | 3.02 | 75.1 | 48.1 | 3.73 | 82.7 |
| REEL u6 | 86.0 | 4.02 | 3.15 | 76.0 | 48.8 | 4.82 | 82.8 |
| REEL u7 | 86.1 | 3.86 | 2.67 | 75.9 | 48.8 | 4.06 | 80.5 |
| REEL u8 | 85.7 | 3.83 | 2.89 | 75.6 | 48.9 | 4.83 | 80.5 |
Present vs. Historic (all values in ppm):
| Chloride | Nitrate | Phosphate | Sulfate | Sodium | Potassium | Calcium | |
| Present Average | 85.8 | 4.42 | 3.22 | 76.0 | 49.3 | 4.94 | 78.7 |
| Present St. Dev. | 0.93 | 0.670 | 0.390 | 0.590 | 0.910 | 0.810 | 3.80 |
| Historical Average | 103 | 0.726 | 0.657 | 102 | 56.6 | 3.63 | 215 |
| Historical St. Dev. | 2.37 | 0.188 | 0.0390 | 2.10 | 1.90 | 0.260 | 60.4 |
| T-test | Lowered | Elevated | Elevated | Lowered | Lowered | Elevated | Lowered |
Upstream vs. Downstream (all values in ppm):
| Chloride | Nitrate | Phosphate | Sulfate | Sodium | Potassium | Calcium | |
| Before SSO: Average | 85.9 | 4.82 | 3.45 | 76.2 | 49.6 | 5.51 | 76.3 |
| After SSO: Average | 85.8 | 4.03 | 2.98 | 75.9 | 49.0 | 4.38 | 81.1 |
| T-test | Same | Same | Same | Same | Same | Same | Same |
Adena Brook vs. Turkey Run (all values in ppm):
| Chloride | Nitrate | Phosphate | Sulfate | Sodium | Potassium | Calcium | |
| Present Average | 85.9 | 4.42 | 3.21 | 76.0 | 49.3 | 4.94 | 78.7 |
| Present St. Dev. | 0.912 | 0.680 | 0.390 | 0.590 | 0.920 | 0.810 | 3.79 |
| Historical Average | 93.6 | 2.61 | 0.675 | 80.6 | 55.8 | 3.47 | 215 |
| Historical St. Dev. | 72.4 | 2.29 | 0.0930 | 29.9 | 33.8 | 0.410 | 60.4 |
| T-test | Same | Same | Elevated | Same | Same | Elevated | Lowered |
Adena Brook vs. 5th Ave and Olentangy River Rd. Site (all values in ppm):
| Chloride | Nitrate | Phosphate | Sulfate | Sodium | Potassium | Calcium | |
| Upstream average | 59.0 | 13.4 | 2.94 | 83.3 | 34.5 | 5.25 | 94.4 |
| Upstream St. Dev. | 25.7 | 3.01 | 0.366 | 17.0 | 13.7 | 1.36 | 15.6 |
| Downstream average | 34.1 | 17.5 | 2.93 | 52.3 | 20.5 | 4.14 | 74.0 |
| Downstream St. Dev. | 2.20 | 0.282 | 0.191 | 0.852 | 1.84 | 0.114 | 1.65 |
| T-test | Same | Same | Same | Different | Same | Same | Same |
Discussion and Conclusion: There are many relevant reasons for monitoring concentrations of certain ions in the Olentangy Watershed. Dissolved nitrates pose a number of health concerns for humans. Nitrates are converted to nitrites and nitrosamines within the gut. Nitrites induce a biochemical anemia by transitioning normal ferrous iron hemoglobin to a ferric iron methemoglobin state, and nitrosamines within the body are linked to gastrointestinal cancers (Zeman et al, 2011). EPA regulations limit nitrate concentrations in drinking water to no greater than 10 ppm. Although average nitrate concentration of 4.42 ppm obtained through the course of this research is lower than EPA regulations, research indicates that long-term exposure to low levels of nitrates may still contribute to health problems. A study by Zeman et al. (2011) demonstrated a relationship between low-level nitrate exposure and increased frequency in gastrointestinal complaints such as heartburn, bone maladies such as osteroarthritis, and a generally lower reported level of health. These harmful effects of long term exposure to low levels of nitrates demonstrate the importance of maintaining as low concentrations as possible.
Phosphates are abundant in living systems and are naturally occurring in soil. In general, phosphates are harmless to human health. Problems arise when excess phosphates are found in water because it causes algal blooms. Algae thrive from the excess nutrients and populate so much that it takes over the general ecosystem within the body of water. Abundant near the surface of the water, the algae block the light from the plants below. As these plants die the oxygen levels become threateningly low for the organisms that inhabit the body of water (Science Daily). HAB, Harmful Algal Blooms, can cause the deaths of many organisms and physical maladies in humans that are exposed to the toxins produced by some forms of algae (US HAB Symposium). The US caps safe levels of phosphates at 0.5-1.0 ppm (Vasudevan). Phosphate levels present in Adena Brook were 3.21±0.39 ppm, at least three times the recommended concentration.
The present vs. historic data shows a possible correlation between the frequency of discharges and the concentrations of chosen ions present in solution. The City of Columbus reported four instances of discharge events in 2011 compared to just one discharge event in 2009 at the Adena Brook location. It is important to note that this comparison does not give a definitive measure of discharge influence in the short term since both locations had the most recent discharge event months before the sample collection.
For all analytes of interest, there was no statistical difference in concentrations for locations upstream versus downstream of the discharge location. These results can be attributed to the fact that the most recent discharge event at Adena Brook occurred in June. The large time gap between discharge and collection likely allowed any increased concentrations of analytes to be diluted and/or carried downstream before they could be measured.
Arguably the most interesting results from Adena Brook and Turkey Run comparison were the elevated phosphate levels at Adena Brook. Turkey Run is a tributary bordering the Ohio State Golf course and theoretically ought to have higher phosphate levels than Adena Brook due to the use of fertilizers and other chemicals for grounds maintenance. Thus, there must be some factor present at Adena Brook to compensate for the higher levels of phosphates, despite the effect of fertilizers at Turkey Run. However, it cannot be stated conclusively that the presence of the SSO at Adena Brook was the sole reason for the increased levels, due to the myriad of environmental factors and differences between the two ecological systems.
Comparing the upstream versus downstream concentrations at the 5th Avenue and Olentangy River Road location, all values were calculated to be statistically the same except for sulfate, which was lower downstream. The results from this analysis suggest that the effects of a SSO discharge event are not very long lasting, possibly due to the greater current and water volume of the Olentangy River compared to one of its tributaries.
Furthermore, in all comparisons, calcium levels were lower in the Adena Brook data from 2011. This could be attributed to the elevated phosphate levels in the present data, which could precipitate with some of the calcium in solution, thus eliminating a large portion of the calcium ions.
Another reoccuring theme throughout the results is that correlation does not necessarily imply causation. The findings of this study could show a link between SSO discharge sites and elevated levels of select analytes but it important to take into account the many variables associated with large ecological systems like the ones studies and their respective contributions to analyte concentrations. Therefore, it is important that future research is conducted to varify any concrete links between sewage overflows and elevated ion concentrations.
Future Considerations: There are a number of considerations and suggestions for future research, such as conducting more in depth studies on the longevity of the effects of the SSO discharge events to yield more substantial conclusions. A possible modification is to collect samples from a single site that has a SSO site, at different points in time after a discharge event. While the current method of comparing different sites had samples collected at different times relative to the date of the discharge event, the proposed method will minimize the introduction of new variables in the system by keeping the site location constant. Another way future research can be used to improve results through the acquisition of more data. There was an extremely short time period available for data collection and a great deal of variability in collection times and locations, which could be corrected by increasing the size of the database.
References:
City of Columbus, Department of Public Utilities. 2004. Retrieved from http://gis.columbus.gov/ssocso/mnmap.aspx (accessed November 22, 2011)
National Recommended Water Quality Criteria. EPA U.S. Environmental Protection Agency. Retrieved from http://water.epa.gov/scitech/swguidance/standards/current/upload/nrwqc-2009.pdf (accessed November 22, 2011)
Olentangy Watershed and Tributaries. FLOW. Retrieved from: http://www.olentangywatershed.org/map/biomonitor2.htm (accessed November 22, 2011)
State of Ohio Environmental Protection Agency. Biological and Water Quality Study of the Olentangy River and Selected Tributaries 1999: Delaware and Franklin Counties, Ohio. 2001. Retrieved from: http://www.epa.state.oh.us/portals/35/documents/OlentangyTSD.pdf (accessed November 22, 2011)
Subramanyan Vasudevan, Jothinathan Lakshimi, Ganapathy Sozhan. Desalination & Water Treatment . 2009. http://web.ebscohost.com/ehost/pdfviewer/pdfviewer?sid=b82fb69d-bfad-4e82-a558-b84d0f3401bd%40sessionmgr13&vid=10&hid=21. (accessed December 2, 2011)
US HAB Symposium. Harmful Algae. 2011. http://www.whoi.edu/redtide. (accessed December 2, 2011)
Water Quality in the Lower Olentangy River Watershed. Friends of the Lower Olentangy Watershed. 2003. Retrieved from: http://www.olentangywatershed.org/files/Inventory/Inventory_section7.pdf (accessed November 22, 2011)
Zeman, Catherine; Beltz, Lisa; Linda, Mark; Maddux, Jean; Depken, Diane; Orr, Jeff; Theran, Patricia; Journal of Environmental Health, 2011 Nov; 74 (4): 8-18.