Preparing scientific figures for manuscripts, presentations and grant applications
Glossary
- Vector format: a graphics format in which images are produced via commands (draw line from x1,y1 to x2,y2). This format can be scaled infinitely with no loss of resolution.
- Raster or bitmat format: Images composed of a grid of pixels in which each pixel has a different color. The resolution of the image is set by the number of pixels (e.g., 150 dpi)
Preferred Software
- Graphics anotating: Powerpoint, Illustrator
- Alternatives: LibreOffice Presenter, Keynote, Inkscape
- Image manipulation: Graphic Converter (Mac), GIMP (LINUX), Photoshop
General rules of thumb
- Use Helvetica or Arial for figure text
- Use sufficiently large text so that it can be clearly read when printed at the intended size
- Do not allow figure elements to clash/overlap (annotations, lines, images, legends)
- When possible, prepare figures using vector format, not raster/bitmap
- Figures should be prepared separately, including annotations/labels, then embedded intact into a text document – do not try to edit a figure within a word processing program!
- Use black and white unless color is necessary to illustrate a point
Preparing nD NMR spectra
- Be sure to simplify the figure to focus the reader’s attention to the spectral features of interest – do not expect a reader to interpret the spectrum on their own. This usually means zooming-in on a region of interest, at the expense of the full spectrum
- If a full spectrum is to be shown, minimize blank space, and ensure that peak labels do not overlap
- From the NMR program, output the spectrum in scalable vector format (usually PS or PDF)
- Import the file into software that can edit vector graphics files (Adobe Illustrator, Inkscape)
- Add/manipulate text and annotations in vector format – change fonts as required
- Crop/expand figures as needed so to minimize blank space around the figure
- Reduce the number of contours and/or inter-contour spacing to minimize file size
- Save annotated spectra in both vector and image formats. The image files should have a minimum resolution of 150-300 dpi for items to be printed.
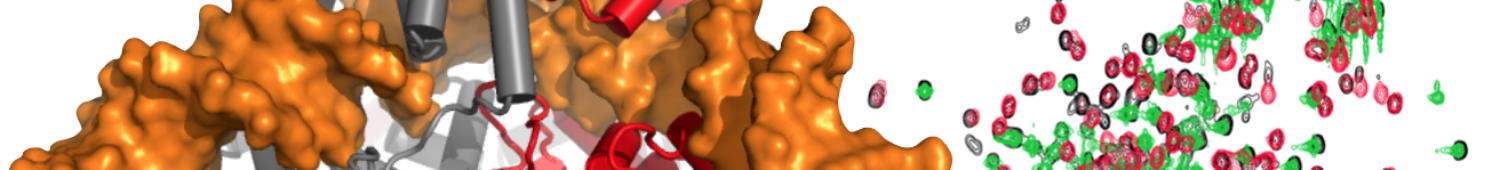
Preparing images of structures (mostly via PyMOL)
- Use PyMOL’s ray-trace mode
- in ribbon diagrams, when showing sidechains via sticks, hide backbone atoms (proteins: n, o and c; NA: o1p, o2p, p), unless they are needed to illustrate a point
- Minimize blank space
- Add annotations in vector format (Powerpoint or Libreoffice Presenter preferred; Keynote, Illustrator or Inkscape OK)
- Generate high-resolution bitmap image (png, jpg or tiff; 300+ dpi).
Importing into documents
- Copy-pasting of images into documents often has unpredictable results.
- DO import/insert figures into the document
- Do NOT draw line borders around embedded images
Figure legends/captions
- Figure legends should describe the figure and the point to be made