
Statistical Tests
Once an experiment is completed, the resultant data requires statistical analysis in order to interpret the results. There are statistical methods available that allow us to make judgments about the data, its relationship to other experimental data and ultimately its relationship with our hypothesis. These methods also allow us to determine the uncertainty (or error) in our measurements and results. The following are brief descriptions of these methods.
Mean (Average) and Standard Deviation
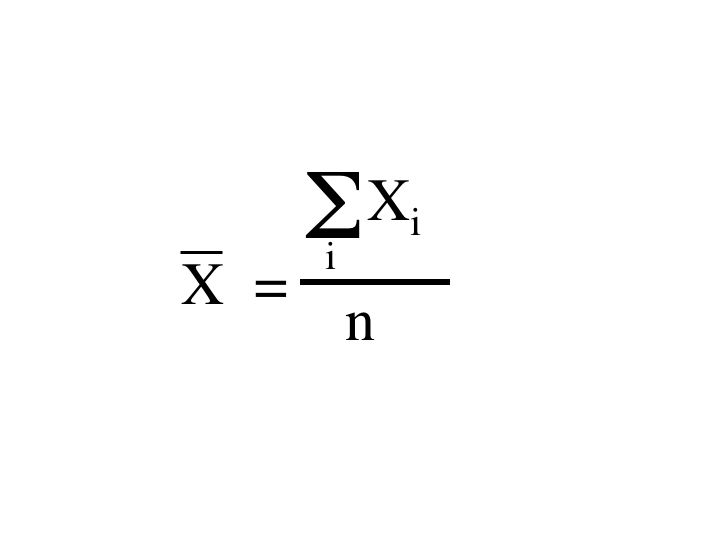
Calculation of the mean
The mean or average is the sum of the measured values divided by the number of measurements.
The standard deviation gives a measurement of the variance of the data to the mean. This value is used in almost all of the statistical tests and it is wise to calculate every time data is being analyzed.
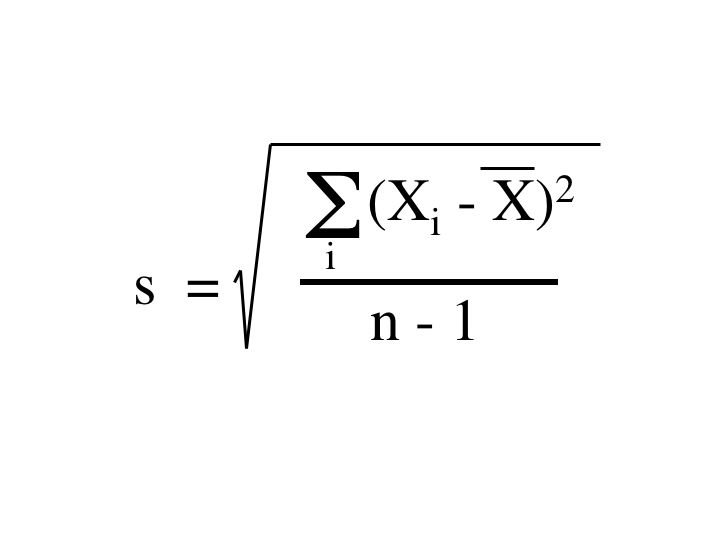
Standard deviation of the mean
Confidence Interval
A confidence interval is an estimated range in which measurements correspond to the given percentile. For example, a 95% confidence interval means that the 95% of the measured values will be within the estimated range. It can also tell precision and stability of the measurements from the uncertainty.
μinterval = ± t*s / √N
μ = true value
= estimated mean
s = estimated standard deviation
N = number of data points
t = student’s t
N-1 = degrees of freedom
Student t-Test
The t-test is a convenient way of comparing the mean one set of measurements with another to determine whether or not they are the “same” (statistically). Its main goal is to test the null hypothesis of the experiment. There are assumptions about the data that must be made before being completed. Once the t value is calculated, it is then compared to a corresponding t value in a t-table. The value in the table is chosen based on the desired confidence level. The higher the % confidence level, the more precise the answers in the data sets will have to be. A 95% confidence level test is generally used.
If the calculated t value is greater than the tabulated t value the two results are considered different. However, one must be cautious when using the t-test since different scenarios require different calculations of the t-value. Three examples can be found in the textbook titled “Quantitative Chemical Analysis” by Daniel Harris. The examples are titled “Comparing a Measured Result with a ‘Known’ Value”, “Comparing Replicate Measurements” and “Paired t test for Comparing Individual Differences”.
F-test
As the t-test describes whether two numbers, or means, are significantly different from each other, the f-test describes whether two standard deviations are significantly different from each other. The difference between the standard deviations may seem like an abstract idea to grasp. This, however, can be thought of a way to test if the deviation between two values places them as equal.
In order to perform the F test, the quotient of the standard deviations squared is compared to a table value. When entering the S1 and S2 into the equation, S1 is always the larger number.
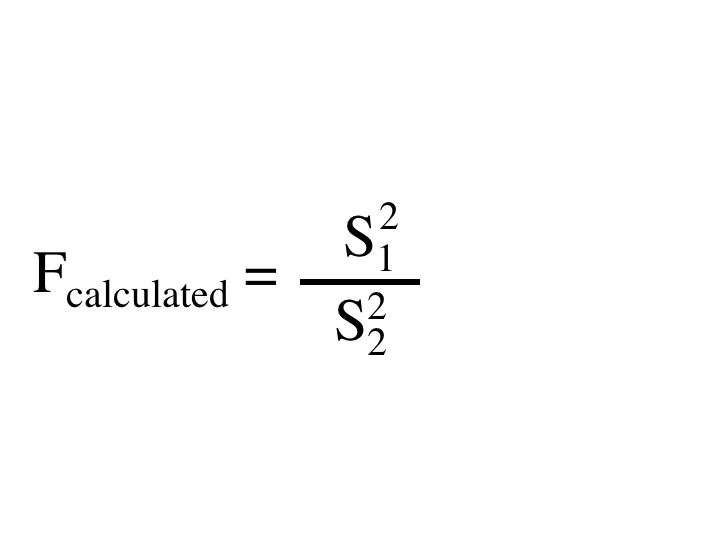
F-Test
This value is compared to a table value constructed by the degrees of freedom in the two sets of data. The table being used will be picked based off of the % confidence level wanting to be determined. The 95% confidence level table is most commonly used. If the calculated F value is smaller than the F value in the table, then the precision is the same, and the results of the two sets of data are precise. If the calculated F value is larger than the F value in the table, the precision is different.
If Fcalculated > Ftable The standard deviations are significantly different from each other.
If Fcalculated < Ftable The standard deviations are not significantly different
Q Test & Grubb’s Test
The Q test is designed to evaluate whether a questionable data point should be retained or discarded. In general, this test can be thought of as a comparison of the difference between the questionable number and the closest value in the set to the range of all numbers. The calculated Q value is the quotient of gap between the value in question and the range from the smallest number to the largest (Qcalculated = gap/range).
This calculated Q value is then compared to a Q value in the table. This table is sorted by the number of observations and each table is based on the percent confidence level chosen.
If Qcalculated > Qtable The number can be discarded
If Qcalculated < Qtable The number should be kept at this confidence level
The Grubb test is also useful when deciding when to discard outliers, however, the Q test can be used each time. Both can be used in this case.
1. Harris, D. Quantitative Chemical Analysis, 7th ed.; W.H. Freeman and Company: New York, 2007; pp 54.
2. University of Toronto. http://www.chem.utoronto.ca/coursenotes/analsci/stats/Outliers.html#section3-8-3 (accessed November 22, 2011)
Content on this web page authored by Brent Sauner, Arlinda Hasanaj, Shannon Brewer, Mina Han, Kathryn Omlor, Harika Kanlamneni & Rachel Putman