Investigation of CSOs and SSOs on the Olentangy River.
Research Contributors:Roxanne Demarest, Bethany Wellen, Brandon Smith, David Sacolick
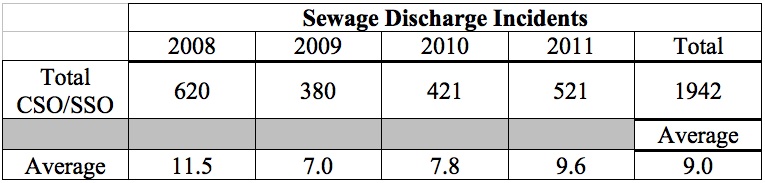
Introduction: The Olentangy River runs through the heart of Columbus and is an integral part of the habitat of wildlife in Columbus. The city of Columbus has 62 CSO/SSO locations on the Olentangy River and its tributaries. CSOs are discharges of a combination of storm water and wastewater from the city’s older combined sewer system. SSOs are discharges of wastewater from the sanitary sewer system, typically during wet weather when flows may temporarily exceed capacity.3 The data of sewage discharge incidents from all 62 CSO/SSO sites along the Olentangy River and tributaries are summarized in the table below:
 With so many sewage overflow locations along the river, there is a need to ensure that the concentration of harmful ions in the river is not increasing to a point that could be dangerous to the local environment.4 In addition to the river containing sewage overflow, it is also a destination for runoff water from agriculture. Our research will be limited to testing only those ions that are of concern for the overall health of the river and its wildlife. The ions that we propose to focus on are nitrates, nitrites, and phosphates. A comparison between present and past ion levels can be done to monitor the change in ion concentration over time. The goal of this research is to determine if there exists a correlation between the number of sewage discharge incidents and the concentrations of nitrates, nitrites, and phosphates in the Olentangy River.
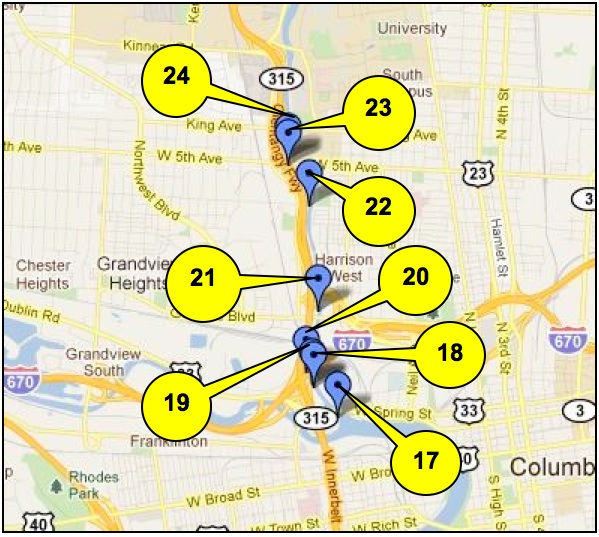
Water samples were collected along the Olentangy River bike path from Confluence Park to Fifth Avenue on Sunday, November 6, 2011. Below is a table of the exact coordinates of the collection sites and a map of the collection sites.

 The samples were collected in plastic 500-mL Nalgene bottles that had been rinsed thrice with the river water from each location. The samples were first filtered before preparation of ion chromatography (IC) vials for analysis.
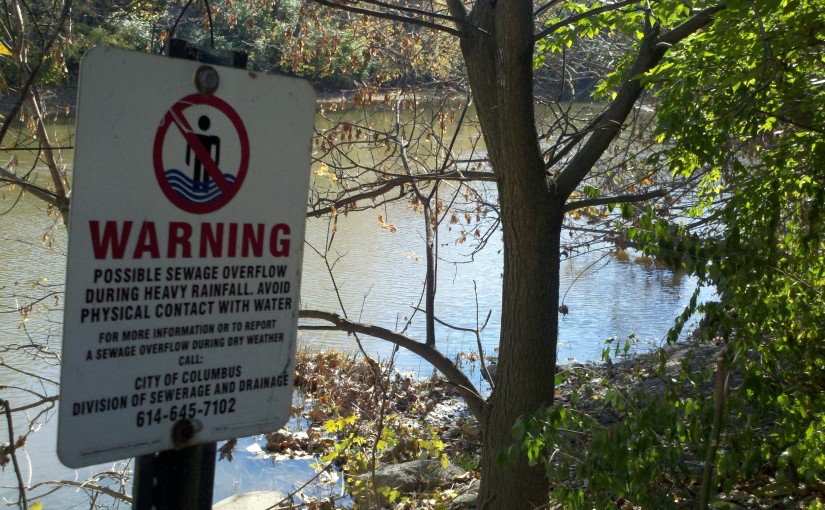
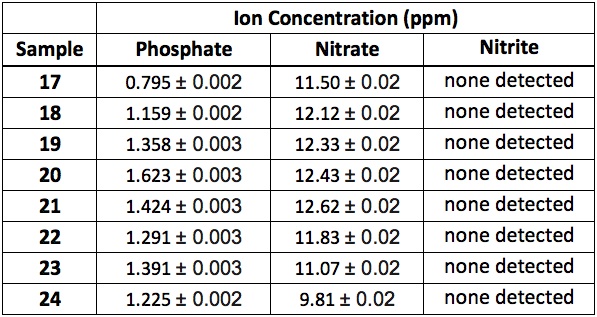
Samples 17-21 were taken downstream from sanitary sewage overflow (SSO) site number 2, sample 22 was taken at SSO site number 2, and samples 23 and 24 were taken upstream from SSO site number 2. Below is a picture taken at the site of sample 22 collection.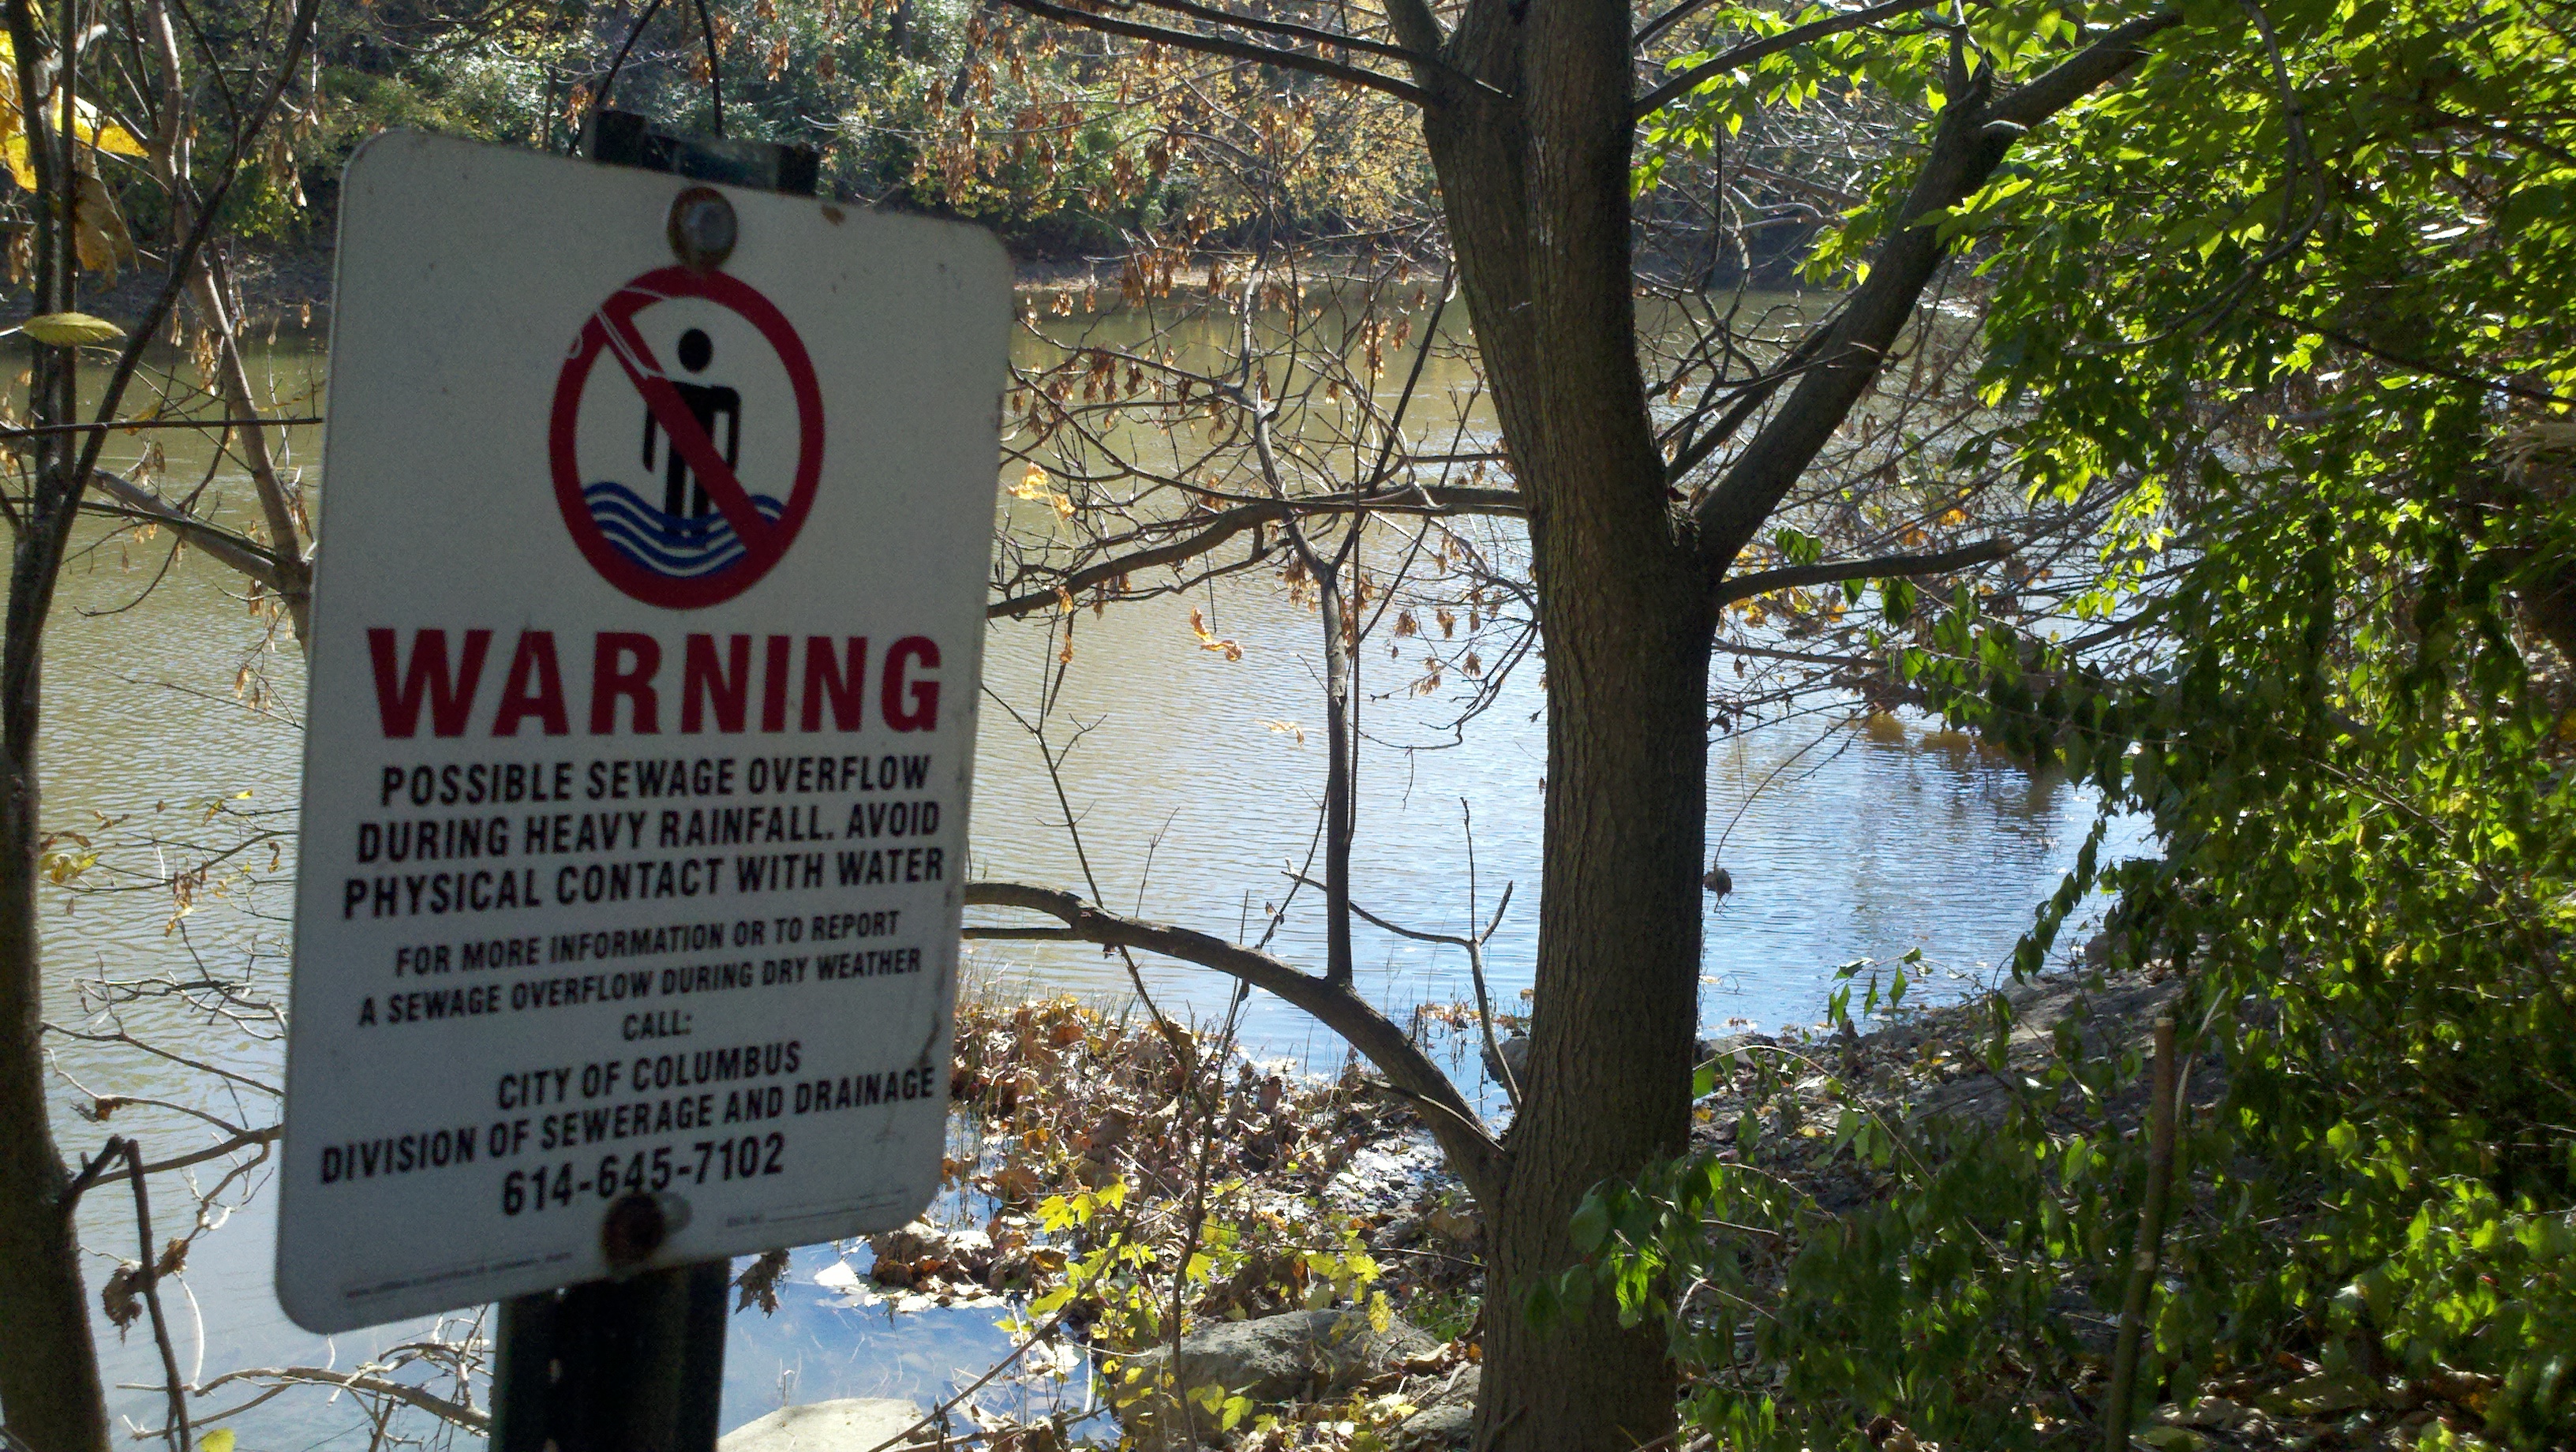 The data for sewage discharge incidents at SSO site number 2 are summarized in the table below:
 Method Validation and Method of Analysis
Three methods of ion analysis were tested for validity: the potentiometric method by precipitation of silver, chloride ion-selective electrode method, and ion chromatography method. When performed by our group, ion chromatography analysis was found to be the most accurate method of analysis for determining the concentration of an unknown ion. Because ion chromatography was the most accurate and time efficient method, and because it analyzes multiple ions at once, it was chosen as the method used to analyze the river water samples.
An ion chromatography calibration curve was constructed for each of the nitrite, nitrate, and phosphate ions using data from standards of each ion that were tested via ion chromatography.
The water samples from the river were analyzed for their ion concentration via ion chromatography. The unknown concentrations of nitrate, nitrite, and phosphate in the river samples were determined using the previously constructed calibration curves.
Results
The phosphate, nitrate, and nitrite concentrations in our samples as determined by the standard calibration curves are presented in the table below:
Data Analysis
Statistical tests were used to determine if our data set is consistent with that of another group that collected water samples from the same locale. After Q-tests were performed on all sets of data, it was determined that no data points could be rejected at the 95% confidence level. F-tests and the Student’s t-test were then conducted to determine whether the data had statistically significant differences at the 95% confidence level. The average values provide the most useful piece of information to this research. When compared to the other set of samples from this year that were collected from Confluence Park to 5th Avenue, the nitrate concentration had a different distribution, but the same average value. The phosphate concentrations had the same distribution and the same average value. Because the average values were not statistically different for both nitrates and phosphates, it can be said that no extraneous human errors were made in the collection and analysis of the water samples.
Class data was used to determine average concentrations for the entire river for nitrates, nitrites, and phosphates. Data from samples collected close to SSO or CSO locations were then analyzed, as well. This data is summarized in the table below:
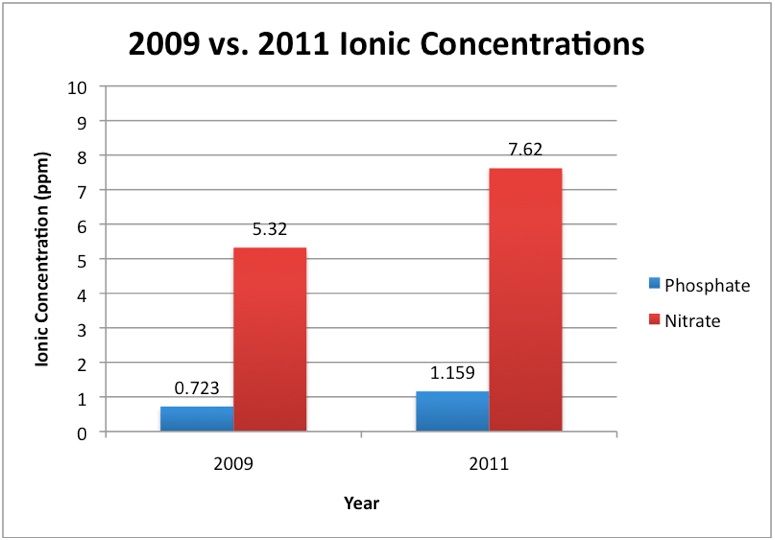
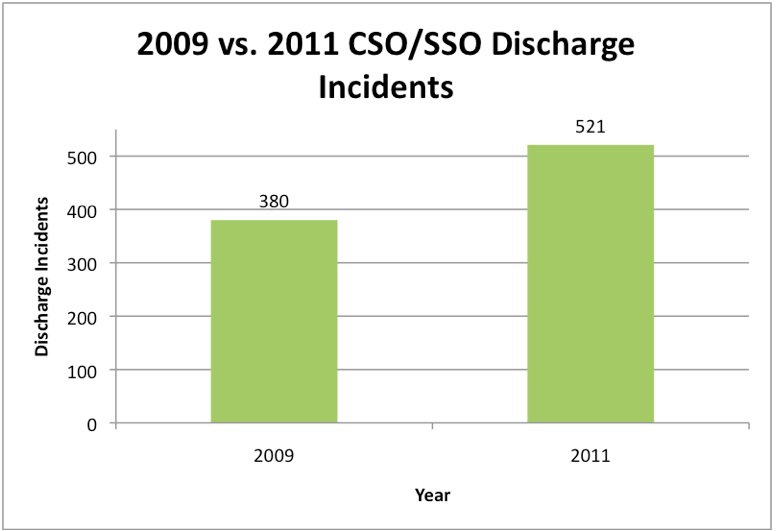
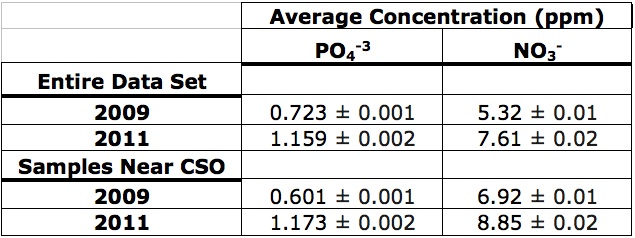 At the 95% confidence level, the entire 2011 data set had a statistically significant increase in the average values for nitrate and phosphate concentrations than the data from 2009. At the 95% confidence level, the data collected from points near a CSO did not have greater concentrations than the data from all locations along the river. Graphs showing a comparison of the ion concentrations and the number of sewage discharge incidents for 2009 verse 2011 are below.
 SourceURL:file:///Users/tedclark/Desktop/221-REEL-Fall2011/Student-Web%20Research%20Reports/Group%203/FinalWebReport(1).doc
Discussion and Conclusions
The increase seen in concentrations between the 2009 and 2011 data sets could be due to either the accumulation of contaminants from sewage discharge over the years or due to the increased number of sewage discharge incidents in this year alone. Recall that in 2011, there have been 521 total incidents, and in 2009, there were only 380 incidents. The concentrations of nitrates and phosphates are correlated to sewage discharges into the river because collection sites near CSOs and SSOs showed higher concentrations of the ions than the average concentration over all collection sites. Further research is needed in order to determine whether this correlation can be extended to be defined as the cause of the elevated ion concentrations.
Further research would need to be conducted in order to build on the correlation found in our study and more accurately distinguish a cause of the increased concentrations. One possibility of further research would entail collecting data from the same locations every year to see if there remains a systematic increase in concentration levels because of ion accumulation over time, or if, indeed, there are lower ion concentration levels in the years with less discharge incidents. In addition to this, another study that can be conducted is to collect data from the same locations immediately after a discharge incident. This would help to determine if the concentration levels of nitrates and phosphates are actually due to sewage discharge, or if they are the result of another form of contamination. Another possible form of contamination is agricultural runoff, because nitrates and phosphates are also found in fertilizers. Overall, in order to expand upon the results we found and to determine causation, further research must be done.
References
1. Holt, R. F., Timmons, D. R., Latterell, J. J. Accumulation of Phosphates in Water. J. Agric. Food Chem. 1970, 18(5), 781-784.
2. Rechenburg, A., Koch, C., Classen, T., Kistemann, T. Impact of Sewage Treatment Plants and Combined Sewer Overflow Basins on the Microbiological Quality of Surface Water. Water Science and Technology. 2006, 54(3), 95-99.
3. City of Columbus, Department of Public Utilities. http://gis.columbus.gov/ssocso/ (accessed November 22, 2011).
4. U.S. Environmental Protection Agency. http://cfpub.epa.gov/npdes/cso/cpolicy_report2004.cfm (accessed November 22, 2011).