
The Effect of Car Exhaust on the pH and Buffer Capacity of River Water in Columbus, OH.
Research Contributors: Parker Brumfield, Amelia Heston, Rebecca Heyse, and Meika Travis
Introduction:
The health of the Columbus waterways is invaluable to the health of the city in general. Without a healthy water supply, human, animal, and plant life would be unable to flourish.1 As a part of the REEL project, samples were collected from rivers throughout the Scioto-Olentangy watershed. The first step in understanding the waterways is to test water at various locations for the presence of certain ions indicative of natural waterways. This paper focuses, in particular, on the presence of the H+ ion, which defines the pH of the water. The group collected water samples from a two mile stretch of the Scioto River, and then determined the pH and buffer capacity of these samples. When combined with data collected by other groups within the research team, they reveal a greater picture of the Scioto-Olentangy watershed. The group hypothesized that pH would decrease and buffer capacity would increase as the carbon dioxide level in the environment increased due to human activity. Buffer capacity and pH can be used as indicators of water quality.2
Procedure: The group was assigned downtown Columbus as its water collecting
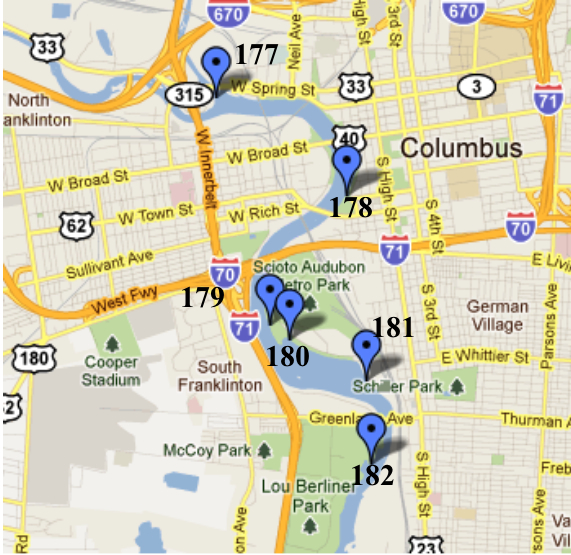
Figure 1: Group Collection Sites
location. Six samples of water were collected over a two mile stretch of river from Confluence Park to Lou Berliner Park. Exact locations can be seen on the adjacent map (Figure 1). The samples were handled according to the standard procedures and then they were analyzed by determining the pH, the buffer capacity, and the concentration of key indicator ions through ion chromatography. The concentration of each ion was determined through the use of calibration curves constructed from the larger dataset of the entire REEL project.3
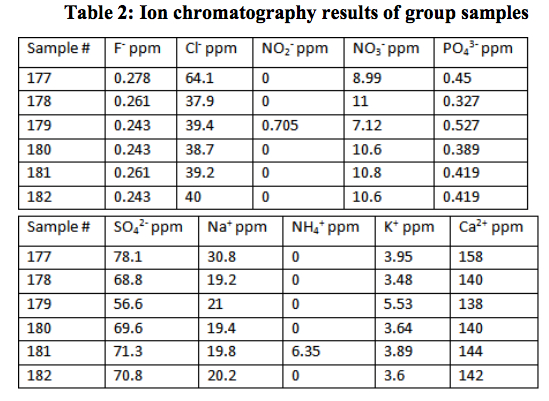
Results: The results of these tests are presented in Table 1 and Table 2. All of the water samples had slightly basic pH values. The buffer capacities did not statistically vary when 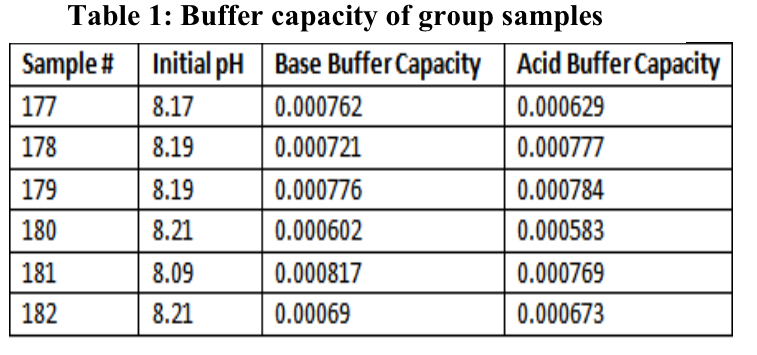 titrated with a 0.1 M strong acid or base. The method of individual differences t-test was applied to prove this statistical significance to the 95% confidence level. The lack of variation shows that the water exists in the middle of its buffering range. This indicates the versatility of the river water as a buffer. Essentially, the water had the ability to equally buffer the solution when either an acid or base was added. The buffer capacity for all the samples averaged to 0.00072±0.00008. It should be noted that the ion concentrations, though important for general analyses, are not relevant to this hypothesis.

Figure 2: Map of comparison points. Red: Bill Moose Run Purple: Olentangy River Blue: Scioto River
Data Analysis:
As presented above, the group expected the pH of the water to decrease and the buffer capacity to increase as the volume of human activity increased. This is theoretically due to the fact that the operation of motor vehicles releases carbon dioxide (CO2). This carbon dioxide is absorbed by water according to the following two equations5: 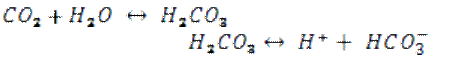
(The second dissociation of bicarbonate is not relevant at the pH observed in the river water, approximately 8, because pKa2=10.329.4) As these equations show, the final products, H+ and HCO3–, affect the pH and buffer capacity, respectively. The presence of more H+ ions decreases the pH, while the presence of more HCO3– increases the buffer capacity.
In order to study this effect, the group decided to look at samples collected at three different locations: a minor tributary (Bill Moose Run), a major tributary (the Olentangy River), and the group’s data from the main river (the Scioto). A map of these chosen locations is shown in Figure 2. It should be noted that the minor tributary is not located near a major road, the major tributary is located near a highway, and the samples from the main river are located beneath a heavily traveled interstate interchange. Again, this is important because automobile exhaust is a major source of carbon dioxide.
In order to determine the validity of the hypothesis, F-tests were performed on the pH and buffer capacity data from the three locations. It was found that all three data sets were not statistically of the same precision for buffer capacity, but they were all statistically of the same precision for pH, all at the 90% confidence interval. The corresponding t-test was then performed on each value. At the 95% confidence interval, the t-test proved that the data sets were all statistically significantly different for buffer capacity. This is in line with the hypothesis that the buffer capacity changes as the volume of human activity increases, but only for one set of locations. The data shows a significant increase in buffer capacity from the minor tributary to the major tributary, whereas it shows a significant decrease from the major tributary to the main river.
The results for pH were also inconsistent with the hypothesis. At the Bill Moose Run site, the pH was 8.20±0.08. As the water flowed downstream to the Olentangy site, the pH decreased to 8.02±0.05. This is not a significant change, according the performed t-test. At the most downstream site, between Confluence and Lou Berliner Parks, the pH then increased to 8.18±0.05, which was a statistically significant increase. A steady decrease in pH was expected.
Conclusions:
The results of the hypothesis presented in this paper are inconclusive. A significant increase in buffer capacity was observed at the first stage of human activity volume increase, but a decrease was found at the second stage. Also at the first stage, no increase in pH was observed and an increase was observed at the second stage. Thus the hypothesis is rejected. This is likely due to the narrow geographic field of study. The group recommends that samples be taken farther upstream and downstream from the city of Columbus in order to further study the effect of car exhaust on the pH and buffer capacity of water. Because the results of pH and buffer capacity analyses did not follow the same trends, it suggests that the relationship between the two properties of river water is not linear as proposed. This also warrants further exploration. As human expansion continues unabated, the impact on the environment must be taken into careful consideration if the disruption of natural homeostasis it to be avoided.
References:
1-Friends of the Scioto River. (2011). “Friends of the Scioto River.” 11/21/11. Retrieved from <http://sciotoriverfriends.org/>
2-Vooren, L. Van, Steene, LM. Van De, Ottoy, J.-P., and Vanrolleghem, P.A. (2001). Automatic Buffer Capacity Model Building for the Purpose of Water Quality Monitoring. 11/18/11.
3-Harris, Justin. “Ion Crhomatography.” Carmen Wiki. Harris, Justin. The Ohio State University. 10/10/11
4-Harris, Daniel C. Quantitative Chemical Analysis. (7 ed.). W. H. Freeman and Company. 2007.
5-Robertson, Jessica. (2011, October 24) “U.S. Rivers and Streams Super Saturated with Carbon Dioxide.” USGS. 11/20/11. Retrieved from <http://www.usgs.gov/blogs/features/ usgs_science_pick/u-s-rivers-and-streams-super-saturated-with-carbon-dioxide/>